Thursday, March 31, 2011

31st March Market Closing Updates

31st March  Market Closing Updates:

Indian markets continued to gain for the eighth day on Thursday
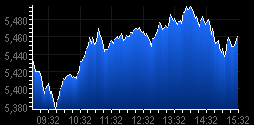
The 30-share benchmark index, BSE Sensex opened with a gain of 49.57 points or 0.26% at 19,339.75, while the broad based NSE Nifty started with a rise of 15.40 points or 0.27%, at 5,803.05.
Sensex Movers
I:nfosys Technologies contributed rise of 29.46 points in the Sensex. It was followed by Tata Consultancy Services (20.94 points), I T C (15.97 points), Reliance Industries (14.84 points) and Larsen & Toubro (13.23 points).

However, State Bank Of India contributed fall of 22.02 points in the Sensex. It was followed by H D F C Bank (11.97 points), I C I C I Bank (10.56 points), Bharti Airtel (10.48 points) and Tata Motors (9.23 points).
Major gainers in the 30-share index:
Hero Honda Motors (2.71%),
Tata Consultancy Services (2.48%),
Hindustan Unilever (1.73%),
Bajaj Auto (1.58%),
Oil & Natural Gas Corporation (1.58%),
Infosys Technologies (1.48%).
The biggest losers in the Sensex:
Reliance Communications (2.91%),
Cipla (2.64%),
Jaiprakash Associates (2.50%),
State Bank Of India (2.21%),
Mahindra & Mahindra (1.84%),
Bharti Airtel (1.81%)
Mid & Small-cap Space
The BSE Mid and small caps underperformed their larger counterparts declining -0.46% and -0.14% respectively.
The major losers in the BSE Midcap were Alstom Projects India (3.07%), Aban Offshore (1.34%), A B G Shipyard (0.63%), A I A Engineering (0.45%) and A2Z Maintenance & Engineering Services (0.36%).
The major losers in the BSE Smallcap were A K Capital Services (3.48%), Abhishek Industries (2.02%), Reliance MediaWorks (1.36%), Action Construction Equipment (0.91%) and Adhunik Metaliks (0.81%).
Sectors in Limelight
The IT index was at 6,510.26, up by 85.28 points or by 1.33%. The major gainers were Tata Consultancy Services (2.48%), Infosys Technologies (1.48%), Tech Mahindra (0.17%) and Patni Computer Systems (0.02%).
The FMCG index was at 3,576.14, up by 39.06 points or by 1.10%. The major gainers were Hindustan Unilever (1.73%), I T C (1.29%), Godrej Consumer Products (1.23%), United Breweries (0.94%) and Dabur India (0.21%).
The Capital Goods index was at 13,365.94, up by 110.80 points or by 0.84%. The major gainers were Havell`S India (2.8%), Larsen & Toubro (1.17%), Bharat Heavy Electricals (0.87%), A B B (0.59%) and BEML (0.31%).
On the other hand, the Bankex index was at 13,248.04, down by 145.28 points or by 1.08%. The major losers were Federal Bank (3.35%), Bank Of Baroda (2.33%), Bank Of India (1.75%), H D F C Bank (1.11%) and I C I C I Bank (0.65%).
Market Breadth
Market breadth was negative with 1,230 advances against 1,489 declines.
Value and Volume Toppers
State Bank Of India topped the value chart on the BSE with a turnover of Rs. 930.18 million. It was followed by Titan Industries (Rs. 540.53 million), Acropetal Technologies (Rs. 441.96 million) and Reliance Industries (Rs. 429.07 million).
The volume chart was led by K Sera Sera with trades of over 14.81 million shares. It was followed by Acropetal Technologies (7.16 million), Smartlink Network Systems (5.46 million) and Cals Refineries (3.91 million).

Wednesday, March 30, 2011

30 March 2011 Closing Market Updates

30 March 2011 Closing Market Updates  16:17


Market opened positive as Asian markets were positive and remained flat as punters are keen on the big match today than the market.Nifty ended at 5798.95 with 62.6 points up while Sensex ended at 19298.64 with 177.84 points in positive. 
Among BSE Sectoral Indices, Consumer durables' Index was the top gainer by 4.01% followed by Realty(+3.36%) and Healthcare Index(+2.05%).
In Nifty50 stocks, Ambujacem was the top gainer by 9.42% and ended at 151.65. Hindalco was the top loser by 1.15% and ended at 205.5.
SBI was the turnover topper by traded value and PFS was the most traded stock on NSE today.
Advance/Decline ratio was positive as 1095 stocks gained and 289 stocks declined today on NSE.
Major World Indices :
HangSeng : +391.07
Nikkei : +249.71
FTSE : +24.58
CAC : +29.85
DAX : +100.15
Dow Futures : +40.00
Nasdaq Futures : +12.75

Tuesday, March 29, 2011

29 March 2011 Closing Market Updates

29 March 2011 Closing Market Updates  15:55


Nifty gained 49.10 points and closed at 5736.35 and Sensex closed on 19121.01 with 177.87 points' maintaining gain its upward journey for the sixth consecutive day on sustained capital inflows as falling crude oil prices eased inflationary concerns.Again Nifty facing resistance of 5740 to close above.March expiry contract ended at 5754.20 with 17.85 points' premium.
All BSE Sectoral Indices closed positive.Top gainer was Auto Index with 1.70% rise followed by Teck, Metal, Consumer Durables, IT and Realty index.
In Nifty50 stocks, Rcom was the top gainer by 4.37% rise and ended at 109.90 whereas IDFC was the top loser by 1.72% and ended at 156.7.
Advance/Decline Ratio was negative as 526 stocks declined and 864 stocks gained today on NSE.
Major World Indices :
Hang Seng : -7.83
Nikkei : -19.45
FTSE : -17.17
CAC : -26.43
DAX : -57.49


FDI down by 30% in February to $ 1.2b


Foreign direct investment (FDI) in India registered its second consecutive decline in February, 2011,dipping by 30 per cent year-on-year to USD 1.2 billion in the backdrop of financial turmoil in Europe.In February, 2010, India attracted foreign direct investment (FDI) worth USD 1.7 billion.
During the 11-month period from April, 2010, to February, 2011, FDI inflows into India declined by 25 per cent to USD 18.3 billion, which makes it imperative for the country to fine-tune its policies to attract overseas investment.
The country received FDI worth USD 24.6 billion during the April-February, 2009-10, period.

Monday, March 28, 2011

28 March, 2011 Closing Market Updates

28 March, 2011 Closing Market Updates  15:53


Market was the bull tide today also despite weakness in Asian indices.Today was the 5th day that market gained consecutively.Nifty gained 29.05 points and ended at 5683.3 and Sensex ended at 18938.01 with 122.37 points' jump.
Among BSE Sectoral Indices, Auto Index gained the most by 1.52% whereas Health care Index was the top loser by 1.05%.
In Nifty50 stocks, Tatamotors was the top gainer by 3.43% which ended at 1224.5 and Sunpharma was the top loser by 3.48% and ended at 442.05
ICICI Bank was the turnover topper by traded value and Unitech was the most traded stock by traded quantity on NSE.
Advance / Decline ratio was negative as 649 stocks gained whereas 741 stocks declined today on NSE.
Major World Indices :
Hang Seng : -90.48
Nikkei : -57.60
FTSE : +16.93
CAC : +11.43
DAX : +18.80
Dow Futures : +29.00
Nasdaq Futures : +10.00

Friday, March 25, 2011

25 March 2011 Closing Market Updates

25 March 2011 Closing Market Updates  15:31


Technically market was into bull grip as it closed above 5533 yesterday.Into addition to that today Asian markets and Europen markets fueled the fire and Nifty zoomed today to end at 5646.25 with 123.85 points gain.Sensex rose 429.82 points to end at 18780.56.
All BSE Sectoral Indices ended in positive.IT Index was the top gainer by 3.80% rise followed by Teck Index(3.31%),Bankex(2.63%),Realty(2.39%) and Capital Goods Index(2.02%).
In Nifty50 stocks, DLF was the top gainer by 5.72% and ended at 247.60.Just 3 stocks ended into Red. Ranbaxy was the top loser by 0.81% and ended at 440.25
Advance/Decline Ratio was positive in 2.07 : 1 ratio as 933 stocks gained and 450 stocks declined today on NSE.
Major World Indices : 
Hang Seng : +243.39
Nikkei : +101.12
FTSE : +33.64
CAC : +13.58
DAX : +42.39
Dow Futures : +39.00
Nasdaq Futures : +9.50


Thursday, March 24, 2011

24 March 2011 Closing Market Updates

24 March 2011 Closing Market Updates  15:30

Inspite of Crude rose to 106.5 $ per barrel, market gained today also.Nifty gained 44.10 points to end at 5524.35 whereas Sensex ended at 18352.61 with 146.45 points' rise.
Among BSE Sectoral Indices, Realty gained the most by 2.85% followed by Auto(+1.44%);Capital Goods(+1.25%);IT(+1.16%).Oil&Gas Index and Healthcare Index were the only losers by 0.05% and 0.08%
In Nifty50 stocks, Hindalco gained the most by 4.46% ended at 205.1 and Gail was the top loser by 1.71% and ended at 458.5
Advance/Decline ratio was positive as 844 stocks gained and 544 stocks declined today on NSE.
Major World Indices : 
Hang Seng : +89.88
Nikkei : -14.46
FTSE : +45.62
CAC : +16.15
DAX : +48.07
Dow Futures : +67.39
Nasdaq Futures : +14..43

Wednesday, March 23, 2011

Alert About Index Options Trading


22 March, 2011

Option schemes face Sebi heat

Regulator warns brokerages, wealth managers against making false promises.

A large number of the so-called 'assured' or 'indicative' return schemes run
by leading stock brokers and financial services firms, mainly in the equity
derivative segment, have come under the regulatory scanner. For, it appears,
investors are being lured into derivative schemes by verbal assurances of
returns, something not permitted by the market regulator, the Securities and
Exchange Board of India (Sebi).

In the recent past, Sebi and the National Stock Exchange (NSE) have received
several complaints against wealth managers or brokers. Complainants say
their money was diverted for trading in index options with a promise of a
certain fixed return. However, they lost money as the bets went wrong.

These schemes have been under watch after a derivative product, Options
Maxima, run by Aditya Birla Finance, lost an estimated Rs 100 crore and went
bust last year. Also, losses to the tune of Rs 300 crore came to light in
the case of trades (mainly index options) conducted by Citi Group's now
jailed wealth manager, Shivraj Puri, through a couple of brokerage houses.

An official from Sebi said, "In most cases, there is a private arrangement
between clients and the sellers of such schemes, so we are issuing warnings
to brokerages against luring clients with promises."

Source, concerns
According to this official, another area of concern was the source of funds,
as index option volumes had surged alarmingly in recent times. "This
requires following of proper know your customer norms, which is where we
will crack the whip if irregularities are found," added the official.

A fat commission on option trades is the key reason why brokerage houses are
encouraging and inducing clients to dabble in this segment. Most brokers
charge a flat fee in the range of Rs 50 to Rs 100 per lot per leg - on each
buy and sell transaction - in the options segment. In cases where volumes
are high, the cost could be lower. Also, the risk element is relatively less
for stock brokers in allowing the clients to trade (especially when buying)
in index options. To play in Nifty options, one has to pay just a premium on
the strike price. This is as low as 1-1.5 per cent of the price of the
asset. However, in the futures segment, the risk for brokers is high, as
clients take positions by paying as much as 20-30 per cent margin money and
it may become difficult to recover the remaining money during crises.

"Due to high competition, brokers are using higher-margin options trades to
enhance their revenues because of high volumes. Sometimes, even the KYC
norms are neglected. Retail investors should be cautious, as there are many
'ifs' and 'buts' attached to such schemes," said a South Mumbai-based equity
advisor.

Not surprisingly, volumes in the options segment have seen a sharp rise. On
the NSE, the share of options trading in the overall derivatives segment
rose to 72 per cent at the beginning of this year. It has continued at that
level. In January 2010, this number was 50 per cent. Of the total option
segment turnover, Nifty index options generate 96 per cent of volumes. On an
average, around Rs 1 lakh crore worth of equity derivatives are traded daily
on NSE. The fact that a majority of the volumes in options trading come from
the retail trade and high net worth individuals (HNIs) are a major cause of
worry, as they stay away from markets for a long time if they make huge
losses once.

"This proves the point that there are a large number of schemes being run by
brokers and wealth managers in private arrangement with clients. Such
schemes cannot be linked to stocks, as daily indicative bets are placed on
the benchmark index," said the head of an institutional desk.

"Relationship managers of broking firms, who are under pressure to meet
targets, are selling these types of derivatives products by verbally
promising assured returns," said the chief executive officer of a domestic
broking firm, on condition of anonymity. "Clients also need to be careful
and understand the product. They start complaining when they make losses."

Published in the Interest of the Investors..

23rd March Market Closing Updates:

23rd March Market Closing Updates  15:31
Lackluster market ended with gains with the help of heavyweights.Nifty closed 70.20 points up at 5484.05 whereas Sensex closed 225.60 point sup at 18213.90.
All BSE Sectoral Indices ended in positive except Consumer Durable Index(-0.01%). Realty index was the top gainer with 1.90% rise.
In Nifty50 stocks, Cipla gained the most by 4.92% to end at 305.95. M&M was the top loser by 1.39% and ended at 645.
ICICI Bank was the turnover topper by traded value and Unitech was the most traded stock on NSE today.
Advance/Decline Ratio was positive as 814 stocks gained and 568 stocks declined today on NSE.
Major World Indices :
Hang Seng : -32.50
Nikkei : -158.85
FTSE : +25.62
CAC : +20.46
DAX : +10.08
Dow Futures : +31.00
Nasdaq Futures : +1.50

Tuesday, March 22, 2011

22nd March Market Closing Updates

22nd March Market Closing Updates
The Sensex pared some of its gasins as profit booking was seen in select heavyweights.The sell-off in HDFC Bank, ICICI Bank, TCS and HUL put some pressure on the market. There was some profit booking too at higher levels in other largecaps, may be due to Middle East tensions. The 30-share benchmark index, BSE Sensex opened with a gain of 90.04 points or 0.50% at 17,929.09, while the broad based NSE Nifty started with a rise of 26.10 points or 0.49%, at 5,390.85.

Sensex Movers
Reliance Industries contributed rise of 25.59 points in the Sensex. It was followed by Housing Development Finance Corporation (16.26 points), Bharti Airtel (14.55 points), State Bank Of India (13.94 points) and I T C (12.91 points).
However, H D F C Bank contributed fall of 2.03 points in the Sensex. It was followed by Tata Consultancy Services (1.86 points), I C I C I Bank (1.59 points), Reliance Infrastructure (0.28 points) and ACC (0.34 points).
Major gainers in the 30-share index
Maruti Suzuki India (3.42%),
D L F (3.17%),
Bharti Airtel (2.74%),
Jaiprakash Associates (2.11%),
Housing Development Finance Corporation (1.58%),
Cipla (1.53%).

The biggest losers in the Sensex.
Jindal Steel & Power (0.45%),
Tata Consultancy Services (0.23%),
H D F C Bank (0.20%),
I C I C I Bank (0.11%)
The BSE Mid and small caps underperformed their larger counterparts gaining 0.78% and 0.54% respectively.
The major gainers in the BSE Midcap were A2Z Maintenance & Engineering Services (2.27%), Core Projects and Technologies (1.72%), A I A Engineering (1.06%), A B G Shipyard (1.01%) and Aban Offshore (0.73%).
The major gainers in the BSE Smallcap were Provogue (India) (1.54%), A B G Infralogistics (1.07%), Abhishek Industries (0.91%), Adhunik Metaliks (0.49%) and A K Capital Services (0.01%).
Sectors in Limelight
The Realty index was at 2,075.93, up by 41.60 points or by 2.04%. The major gainers were Anant Raj Industries (4.07%), Mahindra Lifespace Developers (3.39%), D L F (3.17%), Indiabulls Real Estate (2.37%) and Godrej Properties (0.96%).
The Auto index was at 8,589.93, up by 127.68 points or by 1.51%. The major gainers were Amtek Auto (6.03%), Apollo Tyres (4.09%), Bharat Forge (2.44%), Ashok Leyland (1.84%) and Bajaj Auto (0.21%).
The PSU index was at 8,573.92, up by 100.82 points or by 1.19%. The major gainers were Andhra Bank(1.64%), Bank Of India (1.61%), Balmer Lawrie & Company (0.41%), Bank Of Baroda (0.14%) and Allahabad Bank (0.12%).
The HC index was at 5,861.88, up by 66.45 points or by 1.15%. The major gainers were Aurobindo Pharma (1.68%), Cipla (1.53%), Apollo Hospitals Enterprise (1.14%), Biocon (1.08%) and Cadila Healthcare (1.05%).
Market Breadth
Market breadth was positive with 1,538 advances against 1,306 declines.
Value and Volume Toppers
Acropetal Technologies topped the value chart on the BSE with a turnover of Rs. 2,574.57 million. It was followed by Coal India (Rs. 1,282.08 million), Fineotex Chemical (Rs. 972.09 million) and State Bank Of India (Rs. 758.43 million).
The volume chart was led by Acropetal Technologies with trades of over 24.45 million shares. It was followed by Lanco Infratech (12.36 million), Cals Refineries (11.13 million) and Sanraa Media (6.16 million)

Monday, March 21, 2011

Never go for ULIP but Opt Term Insurance and Invest the premium difference into equity or MF or PPF

पर्याय क्र. १ - पॉलिसीचा प्रकार आहे नफाविरहीत टर्म पॉलिसी. या पॉलिसीला बोनस मिळत नाही, परंतु वार्षिक हप्ता आहे रु. २७६७/-. नफ्यासहीतच्या भाग २ मध्ये विश्लेषण केलेल्या लोकप्रिय पॉलिसीचा वार्षिक हप्ता होता रु. २१९२४/-. दोहोंमधील फरक आहे रु. १९१५७/-. समजा रु. १९,२००/- ही फरकाची रक्कम दरसाल पी. पी. एफ.मध्ये गुंतविली तर दर पाच वर्षांनी काय लाभ मिळू शकतो ते खालील कोष्टकात दर्शविले आहे.या पर्यायामध्ये विमाधारक २५ वर्षांच्या कालावधीनंतर जिवंत असेल तर त्याला विमा कंपनी काहीही देणे लागत नाही. परंतु पी.पी. एफ.ची रक्कमच होते रु. १५,१६,०००/-. या पर्यायातील फक्त गुंतवणुकीचा विचार केला तर २५ वर्षांत विमा कंपनी व पी.पी.एफ.मध्ये गुंतवणूक केलेल्या ५,४९,१७५/- रु.चे त्याला १५,१६,०००/- रु. मिळतात. परताव्याचा दर (आयआरआर) पडतो ७.१२%, म्हणजे अगोदरच्या नफ्यासकटच्या पॉलिसीपेक्षा (५१%) जवळजवळ ४४% जास्त. हातात पडणारी रक्कमही ४,१६,०००/- रु. इतकी जास्त, (जवळजवळ ३७%).
भाग १ मधील पॉलिसीमध्ये आणखी एक फायदा (गुंतवणूकदाराला दाखविलेले गाजर) आहे, तो म्हणजे २५ वर्षांनंतर विमाधारकाला ११,००,०००/- रु. दिल्यानंतरही त्याची पाच लाखाची पॉलिसी चालू राहते. तो फायदा या पर्याय क्र. १ मध्ये नाही. त्यासाठी जास्तीचे पैसे रु. ४,१६,०००/- पोस्टात किंवा बँकेत ८% दराने गुंतविले तर पुढील तीन वर्षांत रक्कम होते रु. ५,२४,०००/-. ही रक्कम आपल्या ‘जिंदगीके बाद’ या विचाराने गुंतवणुकीतच राहू दिली तर फायदाच फायदा.
या बिननफ्याच्या ‘टम’ पॉलिसीचे एजंटला पंचवीस वर्षांत मिळणारे कमिशन आहे सुमारे ४०००/- रु. अगोदरच्या नफ्यासकटच्या पॉलिसीमध्ये होते सुमारे ३३,०००/- बहुतेक याच कारणाने गुंतवणूकदाराला बिननफ्याच्या पॉलिसीच्या बाबतीत संपूर्णपणे माहिती करून दिली जात नसावी अशी शंका घेण्यास वाव आहे.


पर्याय क्र. २ - विमा हप्त्यांच्या फरकाची रक्कम रु. १९,२००/- ही पर्याय क्र. १ मध्ये पी.पी.एफ.मध्ये गुंतविली होती. त्याऐवजी ती विभागून त्यापैकी ९२००/- रु. पी.पी.एफ.मध्ये आणि बाकी १०,०००/- रु. म्युच्युअल फंडाच्या टॅक्स सेव्हिंग स्कीममध्ये गुंतविली तर एकूण रकमेवर आयकरात सूट मिळू शकते. आता गुंतवणुकीच्या दृष्टीने काय फायदा होऊ शकतो त्याचे विवरण पाहूया. म्यु. फंडाच्या स्कीममध्ये पी.पी.एफ. सारखी ठोस परताव्याची हमी नसते. परंतु बऱ्याच स्कीम्सच्या बाबतीत सुरुवातीपासूनचा आढावा घेतला तर द.सा.द.शे. १८% पेक्षा जास्त ग्रोथ दिसून येते. ही ग्रोथ सर्वस्वी शेअरबाजारातील तेजी-मंदीवर अवलंबून असते. तसेच जमा रक्कम कमीत कमी तीन वर्षे परत मिळत नाही. आपल्या कॅल्क्युलेशनसाठी १२% ग्रोथ धरली तर या पर्यायात दर पाच वर्षांनी काय लाभ व्हावयाची शक्यता असू शकते हे खालील कोष्टकात दर्शविले आहे.
या पर्यायानुसार २५ वर्षांच्या टर्मनंतर विमाधारक जिवंत असेल तर विमा कंपनी त्याला काहीही देणे लागत नाही. परंतु पी.पी.एफ. आणि म्यु. फंड टॅक्स सेव्हिंगमधील गुंतवणुकीचे २२,१९,०००/- रु. म्हणजेच नफ्यासकटच्या विमा पॉलिसीपेक्षा त्याला ११,१९,०००/- रु. (२२,१९,०००-११,००,०००) जास्त मिळण्याची शक्यता आहे. त्यामधील त्याने ‘जिंदगी के साथ भी’साठी हवी ती रक्कम ठेवावी आणि उरलेली ‘जिंदगी के बाद भी’साठी बाजूला काढावी. कसे आणि किती ते सर्वस्वी त्याच्यावर अवलंबून आहे.


पर्याय क्र. ३ - वरील पर्याय क्र. २ मध्ये गुंतवणूकदाराने थोडा धोका पत्करला होता. तो म्हणजे दरसाल १०,०००/- रु. त्याने ठोस परतावा नसलेल्या म्यु. फंडाच्या टॅक्स सेव्हिंग स्कीममध्ये गुंतविले होते. ज्या गुंतवणूकदारांनी जास्त धोका पत्करायची तयारी आहे त्यांनी पी. पी. एफ.मधील गुंतवणुकीचे प्रमाण कमी करून जास्त प्रमाणात म्यु. फंडात गुंतवणूक केली तर त्या प्रमाणात जास्तीचा लाभ मिळण्याची शक्यता आहे. ज्यांची जास्त धोका पत्करायची तयारी आहे त्यांनी संपूर्ण फरकाची रक्कम १९२०० रु., समजा १९,०००/- रु. म्यु. फंड टॅक्स से. मध्ये गुंतविले (पी.पी.एफ.चा विचार न करता) तर आयकरात सूट मिळेलच, परंतु त्याचबरोबर लाभाच्या बाबतीत काय परिस्थिती असेल त्याचा खालील कोष्टकावरून अंदाज घेता येईल.
२५ वर्षांच्या टर्मनंतर या पर्यायात विमा कंपनी जरी काहीही देणे लागत नसली तरी गुंतवणुकीचे २८,३७,०००/- रु. मिळण्याची शक्यता आहे. नफ्यासहीतच्या पॉलिसीपेक्षा सुमारे १७,३७,०००/- रु. जास्त.


पर्याय क्र. ४- नफ्यासकटची टर्म पॉलिसी आणि वरील तीन पर्यायांमध्ये गुंतवणुकीच्या पूर्ण रकमेवर आयकरात सूट मिळण्याची तरतूद होती. ज्या गुंतवणुकदारांना विम्याच्या हप्त्यांव्यतिरिक्त इतर गुंतवणुकीच्या रकमेवर आयकरात सूट घ्यायची गरज वाटत नाही त्यांच्यासाठी फरकाची १९,००० रु.ची रक्कम गुंतविण्याचा मार्ग म्हणजे ‘म्यु. फंड इक्विटी ग्रोथ’ स्कीम. त्यात परताव्याची कोणतीही हमी नसते; कारण त्याचा परतावा पूर्णत: शेअरबाजाराच्या तेजी मंदीवर अवलंबून असतो. परंतु त्यापैकी काही स्कीम्सची सुरुवातीपासूनची (एक, दोन किंवा पाच वर्षे नाही) ग्रोथ ३०% (द.सा.द.शे.) पेक्षा जास्त आहे. आपल्या हिशोबासाठी १५% ग्रोथ धरून चाललो तर लाभाच्या बाबतीत काम शक्यतो होऊ शकते त्याचा खालील कोष्टकावरून अंदाज घेता येईल.
या पर्यायामध्ये २५ वर्षांच्या टर्मनंतर विमा कंपनी काहीही देणे लागत नाही. २५ वर्षे भरलेल्या हप्त्यांचे एकूण ६९,१७५ रु. अक्कलखाती जमा. परंतु म्यु. फंडाच्या गुंतवणुकीची रक्कम ४६,४९,०००/- रु. इतकी व्हायची शक्यता आहे.

21 March 2011 Closing Market Updates

21 March 2011 Closing Market Updates  15:30


Market opened in positive as Hang Seng was up at early trades but later the fear factor of Libiya and its impact on Crude Oil Prices worries dragged market down to end up in negative. Nifty ended with just 3.85 points down at 5369.85 and Sensex ended with 24.24 points down at 17854.57.
Among BSE Sectoral Indices, Healthcare Index gained the most by 0.15% and Realty Index was the top loser by 0.76%.
In Nifty50 stocks, Sail was the top gainer by 2.40% to end at 160.3 and Ranbaxy was the top loser by 6.81% and ended at 436.90
Reliance was the turnover topper by traded value and Unitech was the most traded stock by traded quantity in NSE today.
Advance/Decline ratio was negative as 858 stocks declined and 520 stocks gained today on NSE.


Major World Indices :
Hang Seng : +384.99
Nikkei : +244.08
FTSE : +64.4
CAC : +72.17
DAX : +140.27
Dow Futures : +109
Nasdaq Futures : +26.25

Friday, March 18, 2011

18th March 2011 Closing Market Updates

18th March 2011 Closing Market Updates
The Sensex traded below 18,000 mark as aggressive selling is being witnessed across board. All sectoral indices are trading in red with oil & gas stocks hitting most.

Bears seemed to have taken control of the market as soaring crude prices and central bank’s latest set of rate hikes continued to weigh on sentiment. The Nifty was perilously trading close to support level of 5375 and traders would watch if Nifty manages to close above 5400.US crude oil futures jumped USD 2 a barrel after Thursday's settlement following a vote by the United Nations Security Council authorizing the imposition of a no-fly zone over Libya.The Sensex was down 199.14 points or 1.10% at 17950.73, and theNifty was down 52.05 points or 0.96% at 5394.60. About 1063 shares advanced, 1618 shares declined, and 689 shares remain unchanged.
Sensex Movers
Reliance Industries contributed fall of 79.37 points in the Sensex. It was followed by Housing Development Finance Corporation (22.62 points), Infosys Technologies (22.36 points), H D F C Bank (13.99 points) and I T C (13.21 points).
However, Maruti Suzuki India contributed rise of 1.81 points in the Sensex. It was followed by Tata Steel (1.74 points), Grasim Industries (0.33 points), Hero Honda Motors (0.04 points) and Sun Pharmaceutical Industries (0.08 points)

Mid & Small-cap Space
The BSE Mid and small caps outperformed their larger counterparts declining-0.33% and -0.47% respectively.
The major losers in the BSE Midcap were Aban Offshore (0.46%), A2Z Maintenance & Engineering Services (0.41%), A B G Shipyard (0.3%), Alfa-Laval (India) (0.19%) and Alstom Projects India (0.09%).
The major losers in the BSE Smallcap were Abhishek Industries (2.45%), Provogue (India) (2.01%), Action Construction Equipment (1.38%), A K Capital Services (0.59%) and Aarti Industries (0.41%).
Sectors in Limelight
The Oil & Gas index was at 9,690.88, down by 263.39 points or by 2.65%. The major losers were Hindustan Petroleum Corporation (3.15%), Bharat Petroleum Corporation (1.9%), Indian Oil Corporation (1.39%), Oil India (1.33%) and G A I L (India) (1.03%).
The IT index was at 6,000.93, down by 81.59 points or by 1.34%. The major losers were Tech Mahindra (2.37%), H C L Technologies (2.31%), Infosys Technologies (1.22%), Oracle Financial Services Software (0.53%) and Patni Computer Systems (0.01%).
The Realty index was at 2,064.05, down by 23.66 points or by 1.13%. The major losers were Indiabulls Real Estate (2.31%), Ackruti City (0.97%), Anant Raj Industries (0.72%), Mahindra Lifespace Developers (0.41%) and D L F (0.23%).
On the other hand, the Metal index was at 15,336.06, up by 42.94 points or by 0.28%. The major gainers were NMDC (3.51%), JSW Steel (0.8%), Sesa Goa (0.6%), Bhushan Steel (0.5%) and Hindustan Zinc (0.39%).
Market Breadth
Market breadth was negative with 1,019 advances against 1,664 declines.
Value and Volume Toppers
Reliance Industries topped the value chart on the BSE with a turnover of Rs. 1,326.43 million. It was followed by Tata Coffee (Rs. 902.96 million), Acropetal Technologies (Rs. 834.89 million) and State Bank Of India (Rs. 617.17 million).
The volume chart was led by Cals Refineries with trades of over 35.43 million shares. It was followed by Acropetal Technologies (6.74 million), Bampsl Securities (4.34 million) and Teledata Technology Solutions (3.37 million)

18th March 2011 Closing Market Updates

18th March 2011 Closing Market Updates

Thursday, March 17, 2011

17 March 2011 Closing Market Updates

17 March 2011 Closing Market Updates  15:30


Market witnessed pessimism as RBI raised REPO and Reverse REPO rates keeping CRR unchanged, market nose down today. Nifty ended at 5454.55 with a 56.6 points drop whereas Sensex lost 192.55 points to end at 18166.14
Among BSE Sectoral Indices, Power Index was the top gainer by 0.24% and IT was the major loser by 1.45%
In Nifty50 stocks,RCom was the to gainer by 3.20% and ended at 106.3 and Maruti was the top loser by 4.29% to end at 1167.
ICICI Bank was the turnover topper by the traded value and Rcom was the most traded stock on NSE today.
Advance/Decline ratio was negative as 884 stocks declined and 487 stocks gained today on NSE.

17 March 2011 REPO & Reverse REPO raised by 0.25%

17 March 2011 RBI Credit Policy :

The RBI raised repo (rate at which it lends to banks) and reverse repo (rate at which it borrows) rates by 25 basis points each, taking repo to 6.75% and reverse repo to 5.75%. However, the CRR has been left unchanged at 6%.

The bank also raised March-end inflation forecast around 8% from 7% earlier, leaving GDP growth forecast unchanged at 8.6%. RBI, in its mid-term credit policy said that rising commodity prices was adding to GDP and inflation risk. Also, this upside risk to inflation has stemmed from high crude prices, the report stated adding that industrial production (IIP) continued to be volatile.
The global scenario, the Reserve Bank said portrayed a mixed picture and was likely to persist with current anti-inflationary stance. Further, the report stated that though it was too early to assess the impact on Japan disaster, investment momentum may be slowing down.

Wednesday, March 16, 2011

16th March 2011 Closing Market Updates:

16th March 2011 Closing Market Updates:
Nifty closed 62.40 points  up at 5512.05
Sensex closed 208.12 points  up at 18375.76

The equity benchmarks recouped all their previous day's losses today on the back of recovery in global markets. But there was some profit booking at higher levels, which could be because of rise in crude oil prices again.
London Brent crude went up by USD 1.6 to USD 110.4 a barrel after Bahraini security forces attempted to clear protesters on Wednesday, rebounding from a three-week low near USD 107 earlier in the day. The Nymex crude was inching up towards USD 99 a barrel at 13:50 hours.
Financial, technology, telecom, infrastructure, oil & gas, metal, realty and cement companies' shares were leading the markets higher. However, HUL, GAIL and Hero Honda were the only losers on the Nifty. About four shares advanced as against one share declined on the National Stock Exchange.
The European markets too were quite supportive in the afternoon trade, after rebound in Asian and the US markets; Germany's DAX went up 1%. France's CAC and Britain's FTSE were flat with positive bias.
Sensex Movers

I C I C I Bank contributed rise of 45.07 points in the Sensex. It was followed by State Bank Of India (23.05 points), Tata Consultancy Services (18.49 points), Larsen & Toubro (14.78 points) and Infosys Technologies (11.58 points).
However, Hindustan Unilever contributed fall of 4.13 points in the Sensex. It was followed by Hindalco Industries (0.94 points), Hero Honda Motors (0.5 points), Oil & Natural Gas Corporation (1.12 points) and Housing Development Finance Corporation (1.24 points).
Major gainers
Reliance Energy (5.92%),
I C I C I Bank (3.08%),
Reliance Communications (2.92%),
State Bank Of India (2.48%),
D L F (2.40%),
Tata Consultancy Services (2.31%).
Major losers
Hindustan Unilever (1.07%),
Hindalco Industries (0.27%),
Hero Honda Motors (0.26%)
Mid & Small-cap Space
The BSE Mid and small caps outperformed their larger counterparts gaining 1.48% and 1.45% respectively.
The major gainers in the BSE Midcap were A2Z Maintenance & Engineering Services (2.51%), A B G Shipyard (2.41%), Alstom Projects India (1.84%), Aban Offshore (1.42%) and Core Projects and Technologies (1.09%).
The major gainers in the BSE Smallcap were A K Capital Services (3.44%), A B G Infralogistics (1.37%), INEOS ABS (India) (1.11%), Abhishek Industries (0.59%) and Aarti Industries (0.31%).
Sectors in Limelight
The Realty index was at 2,104.44, up by 50.75 points or by 2.47%. The major gainers were Anant Raj Industries (3.09%), D L F (2.4%), Indiabulls Real Estate (2.23%), Ackruti City (1.62%) and D B Realty (1.4%).
The Consumer Durables index was at 5,874.29, up by 126.61 points or by 2.20%. The major gainers were whirlpool Of India (5.11%), Blue Star (1.18%), Rajesh Exports (0.94%), Gitanjali Gems (0.78%) and Bajaj Electricals (0.7%).
The Bankex index was at 12,439.91, up by 263.24 points or by 2.16%. The major gainers were Canara Bank(3.03%), Federal Bank (2.25%), Bank Of India (1.66%), Bank Of Baroda (1.32%) and H D F C Bank (0.43%).
The HC index was at 5,870.43, up by 91.31 points or by 1.58%. The major gainers were Biocon (3.12%), Apollo Hospitals Enterprise (2.73%), Aurobindo Pharma (2.61%), Cipla (0.64%) and Cadila Healthcare (0.52%).
Market Breadth
Market breadth was positive with 1,871 advances against 952 declines.
Value and Volume Toppers
Tata Coffee topped the value chart on the BSE with a turnover of Rs. 1,520.37 million. It was followed by Fineotex Chemical (Rs. 1,376.99 million), V I P Industries (Rs. 1,064.52 million) and B F Utilities (Rs. 945.12 million).
The volume chart was led by Cals Refineries with trades of over 18.42 million shares. It was followed by Fineotex Chemical (8.96 million), Sudar Garments (4.70 million) ) and Acropetal Technologies (4.31 million).

16 March 2011 Daily Recommendations

16 March, 2011 Morning Market Updates  09:20

Nifty Support 5370 Resistance 5550


BankNifty support 10640 Resistance 10940

Note : Follow Buy Calls in Positive market bias and v.v.
Buy Bajajhind sl 65 T 74 Positional
Buy Cipla Abv 302 sl 298 T 310
Buy KFA Abv 42.5 sl 41 T 44.5
Sell Aban Bel 582 sl 600 T 558
Sell Divislab sl 614 T 605
Sell DLF Bel 219 sl 221 T 216
Sell HDIL sl 159 T 150
Sell Ibrealest Bel 109 sl 111 T 106.5
Sell LICHSGFIN Bel 191 sl 193.5 T 186
Sell M&M sl 650 T 633


Tuesday, March 15, 2011

15 March 2011 Closing Market Updates

15 March 2011 Closing Market Updates  15:48


Market opened with gap down on Asian weakness.Nifty collapsed 157 points in early trades. It recovered and ended at 5460.80 with 70.70 points of loss.Sensex lost 245.72 points and ended at 18193.76
Among BSE Sectoral Indices, Oil&Gas Index ended in positive with 0.21% gain and Realty was the top loser by 3.25% 
In Nifty50 stocks, Reliance was the top gainer by 1.73% and ended at 1036 whereas Sesagoa was the top loser by 4.12% fall which ended at 260.65
Advance/Decline ratio was negative as 1137 stocks declined and 266 stocks gained today on NSE.


Major World Indices :
HangSeng : -667.63 (-2.86%)
Nikkei : -1015.34  (-10.55 %)
FTSE : -169.45 (-2.93%) 
CAC : -128.20 (-3.31%)
DAX : -368.14(-5.36%)


Monday, March 14, 2011

14 March 2011 Closing Market Updates

14 March 2011 Closing Market Updates  15:30


Market has discounted Japan's terror and bounced to record gain today. Nifty gained 89.70 points and ended at 5535.15 whereas Sensex gained 281.6 points and ended at  18455.69 points.
All BSE Sectoral Indices ended in positive.Oil&Gas Index rose the most 2.23% followed by Metal Index(1.99%), Bankex(1.53%), and IT(1.49%).
In Nifty50 stocks, Relcapital was the top gainer by 9.9 %, ended at 562.85 and Suzlon was the top loser by 2.73% and ended at 46.3.
Reliance was the turnover topper by traded value and Suzlon was the most traded stock by traded quantity on NSE today.
Advance/Decline Ratio was positive as 762 stocks gained and 610 stocks declined today on NSE.


Major World Indices :
Hang Seng : -31.95
Nikkei : -179.95
FTSE : -16.62
DAX : -81.60
CAC : -35.31
Dow Futures : +84.00
Nasdaq Futures : +19.25


Friday, March 11, 2011

11 March,2011 Closing Market Updates 15:30


11 March,2011 Closing Market Updates  15:30
Tsunami threatened market and Nifty ended with cautious note at 5449.85 with 44.55 points down whereas Sensex dropoped 132.32 points and ended at 18195.66. Market covered after making low on IIP numbers' disclosure. January IIP fig came out with 3.7% against 1.6% in December.
Among BSE Sectoral Indices, Oil & Gas Index was the major gainer by 0.85% and Metal Index was the top loser with 1.95%.
In Nifty50 stocks, Ranbaxy rose the most by 2.26% and ended at 461.Bhel was the top loser by 3.90% and ended at 1972.
Tatacoffee was the turnover topper by traded value and Unitech was the most traded stock by the quantity traded.
Advance/Decline Ratio was negative as 1048 stocks declined and 349 stocks gained today on NSE.

IIP Data :
The Index for Industrial Production (IIP) has come in at 3.7% for January, much higher than street estimates. According to a CNBC-TV18 poll, industrial output was estimated to be at 2.7% (YoY).
The capital goods sector has hugely disappointed with a degrowth of (-)18.6% versus 57.9% (YoY). However, surprises came in from electricity sector which saw an annual growth at 10.5% against 5.6%. Consumer non-durable goods grew at 6.9% (YoY) compared to (-)7%.
Starting from December itself, India has been struggling with a very high base which itself is bound to keep numbers a little lower. IIP had hit 20-month low of 1.6% in December.
Food and fuel inflation eased in late-February, but remained at elevated levels, maintaining the case for further monetary tightening to keep a lid on headline inflation.
India's food price index rose an annual 9.52% in the week to February 26, slower than a 10.39% rise in the previous week as prices of vegetables, potatoes and rice declined, data showed on Thursday.
The HSBC Markit Purchasing Managers' Index, an indicator of manufacturing expansion, rose to a three-month high of 57.9 in February from 56.8 in January.
That was the 23rd consecutive month the key index of manufacturing in Asia's third-largest economy has been above the 50 mark, that divides growth from contraction.
The manufacturing sector grew 5.6% in October-December from a year earlier, government data released on February 28 showed. India's exports in January rose an annual 32.4% to USD 20.6 billion, government data released last week showed.
Sector-wise growth in January
  • Manufacturing sector growth at 3.3% vs 17.9% (YoY)
  • Mining sector growth at 1.6% vs 15.3% (YoY)
  • Capital goods growth at (-)18.6% vs 57.9% (YoY)
  • Electricity sector growth at 10.5% vs 5.6% (YoY)
  • Basic goods growth at 7.6% vs 11.5% (YoY)
  • Intermediate goods growth at 7.9% vs 22.2% (YoY)
  • Consumer goods growth at 11.3% vs 0.4% (YoY)
  • Consumer durable goods growth at 23.3% vs 28.2% (YoY)
  • Consumer non-durable goods growth at 6.9% vs (-)7% (YoY)